All models are wrong, but some are tragically misleading
The deferred evacuations at Fukushima
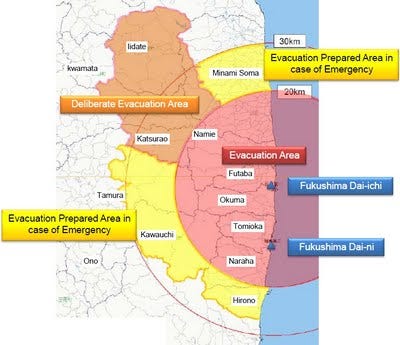
Figure 1. Fukushima Evacuation Areas
Table 1 summarizes the Gordian Knot Group's analysis of the Fukushima release. The GKG divides each town's population into ten equally sized sub-groups, spread equally from the worst hit parts of the town to the least hit. We then estimate the dose rate profile for each sub-group, assuming nobody evacuates, based on the initial (peak) ambient dose rate, and the release's composition. Once we have sub-group profiles, it is straightforward to estimate the SNT cancer mortality and Lost life Expectancy and compare those numbers with LNT's predictions. See Underwriter Certification 2.0 for details. For present purposes, focus on the high end (initial) ambient dose rate column.
It is interesting to compare these dose rate numbers with a Union of Concerned Scientist (UCS) figure. The UCS is a group that is, to put it politely, highly critical of nuclear power. In 2014, they published an in depth, book length study of the Fukushima release.\cite{lochbaum-2014} On page 178, we find
Radiation data gathered by the Ministry of Education and Science showed pockets of extremely high readings across the contamination zone. In the town of Okuma, two miles southwest of Fukushima Daiichi, some areas recorded radiation levels in excess of fifty rems per year.\cite{lochbaum-2014}[p 178]
Given the UCS's antipathy toward nuclear, we can reasonably assume this is the highest off site, dose rate the UCS was able to find. 50 rems per year is 57 microGy/h. GKG's own analysis of Fukushima, Table 1, agrees that Okuma was the hardest hit town. We put the top dose rate there at 310 microGy/h with an average of 163 for the town. Our numbers are more pessimistic than the UCS's.
Most people do not realize how delayed portions of the Fukushima evacuation were. I certainly did not. By the end of March, the situation at the plant was under control. Power had been restored to the site. The team was getting water to all the stricken reactors. The temperatures were coming down. The release rate was one ten thousandth of what it had been earlier.\cite{tepco-2012a}[p 51]
The government fully expected to restart Japan's reactors quickly. The job was mainly clean up and rebuild from the tsunami. They were quite taken back when the public led by a normally tame press turned against nuclear power, threatening the ruling Democratic party.
The politicians responded. On April 22, 40 days after the start of the release, the government implemented two new evacuation zones, Figure 1. The area out to 20 kilometers from the plant had already been evacuated.
The Deliberate Evacuation Area (DEA)
The DEA was an extension of the 20 km circle northwest from the plant. This area had been hit by washout from the plume during rainfall, mainly on the 15th. The DEA consisted largely of the village of Iitate. The Deliberate Evacuation Area (DEA) was ordered evacuated by the end of May.
Figure 2 shows the GKG dose rate profile for the high end Iitate population. GKG estimates the peak high end ambient dose rate for this town was 47 microGy/h, not that much lower than UCS's number for Okuma. According to LNT, making these people evacuate after 50 days increased their life expectancy by 24 days. For most of the citizens of Iitate, the numbers would be lower to much lower. According to SNT, forcing these to people to evacuate after 50 days, increased their life expectancy by 1.7 minutes. The stress of evacuation will be far, far more costly.
Figure 2. Dose rate profile, Iitate high end group. Red is SNT mortality. Read right. LLE is Lost Life Expectancy.
Because of the drop off in the dose rate, mainly due to Iodine-131 decay, according to SNT at day 50, this group has already experienced 25% of its 40 year exposure Lost Life Expectancy. LNT claims that number is only 4%.
I'm sure the government's thinking was focused on cumulative dose. Under LNT, the harm just keeps building up. In a nuclear power plant release, after the initial rapid decline, the dose rate falls off very slowly. The cumulative dose for the Iitate high end group after a 40 year exposure period is 613 mSv. For an LNTer, this is a scary number, since it only took a 150 mSv or so acute dose to produce significant increases in cancer in the bomb survivors. For an LNTer, the fact that the bomb survivors suffered most of their dose in seconds, while the Iitate citizens will receive their dose fairly evenly over 40 years is irrelevant. Given our rate dependent ability to repair radiation damage, this is biological nonsense.
The Evacuation Prepared Area (EPA)
The Evacuation Prepared Area was the entire 20 to 30 km ring from the plant except for that portion of the ring that was in the DEA. In other words, the EPA was the portion of 20 to 30 km ring that had escaped the March 15 washout. The EPA includes large parts of Miamisoma and Tamura, by far the largest towns in the region. Late in April, women and children in the EPA were advised to evacuate and the men were told to be prepared to evacuate on a moment's notice for fear of some unnamed emergency.
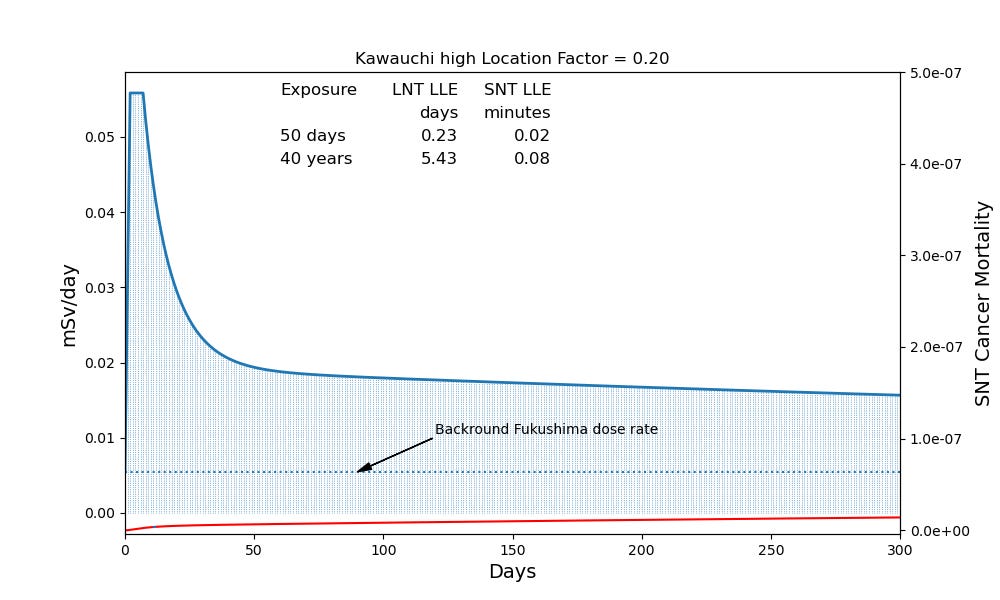
Suitably frightened, nearly half of the 58,000 people in the EPA evacuated.\cite{lochbaum-2014}[p 241] As of 2014, only 3000 had returned. A sizable portion of Miamisoma is inside either the 20 km mandatory evacuation zone or the DEA, so I'm going to use the Kawauchi Village high end group to characterize the worst case EPA population. GKG estimates this group started out at 10 microGy/h, which is also about the middle of the much larger Miamisoma population. Figure 3 shows the GKG analysis for these people.
Figure 3. Dose rate profile, Kawauchi high end group. Vertical scales different from Figure 2.
This is so stupidly tragic that I don't know where to begin. The peak dose rate in the EPA was around 0.06 mSv/d and lasted roughly 10 days. In the Karunagappally study, Figure 4, the people who got 0.06 mSv/d showed no increase in cancer and they averaged that dose rate for at least 19 years. By day 50, when most of these people were frightened into leaving, the dose rate was down to around 0.02 mSv/d. In the Karunagappally study, we have nearly a million person-years at this dose rate or higher with no increase in cancer. And most of these people experienced these dose rates their whole life.
Figure 4. Karunagappally cohort, 2021 update.\cite{amma-2021}
The people in the EPA had their lives uprooted, and in many cases ruined for no reason at all. Or rather by a model that is tragically misleading. Given its consequences, I have no problem calling LNT evil. What does that say about its promoters?


Duhhh... that's too complicated for me. Can't we just say "Radiation BAAAAD"? Zero tolerance is so much easier! And all we have to give up is Modern Civilization, which everyone tells me is awful anyway, right? -- Typical Person
(Irrational) fear is the mind-killer.