The Bomb Survivors and NCRP Commentary 27
This piece will test the choir's attention span. It's way too long and far too far into the weeds for substack. Call it extra credit for those persistent enough to get to the surprising ending. As usual, a properly referenced PDF is on the Flop book site.
Back to the Dumbest Graph
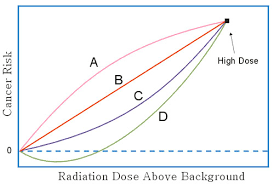
Figure 1. Possible responses to an acute dose. Where is the S curve???
Recently I called Figure 1 the dumbest graph of all time because it ignores the all important time dimension in radiation damage and repair. Figure 1 implicitly assumes that all the dose is received over a very short period or acutely. In a nuclear power plant release, this is never the case, at least for the public. To model the damage repair process, the Gordian Knot Group proposes the Sigmoid No Threshold (SNT) model. SNT says pick a repair period, treat the dose in that repair period as if it were received acutely, and then add up the repair period harms. For this to work, the response to an acute dose must be non-linear. If it is linear, then we are back to LNT.
SNT assumes the response to an acute dose is S-shaped, which means it must be concave upward at the low end. That shape is supported by biology that claims that closely spaced Double Strand Breaks (DDSB) are the real problem, because this is the form of DNA damage which is most likely to lead to viable misrepairs which can end up as cancer.
SNT needs acute dose data to determine the parameters of that S curve. Almost by default, SNT is forced to use the RERF atom bomb survivors data base for that purposes.1 Despite the manifold problems with this data, it is regarded as the Goldstandard of acute dose data if for no other reason than the amount of money that has been spent on this 70 year program. When we fit a five parameter logistic to the bomb survivor cancer incidence data, we end up with an S in which the lower hook was much smaller that the upper, and the lower hook was approximately a power law with an exponent of 2.18. Both results fit nicely with the DDSB theory.
But wait a minute. The radiation protection establishment claims the RERF data strongly supports LNT, which means the response must be linear. But what do the establishment's own studies of the RERF acute dose response say?
Leukemia
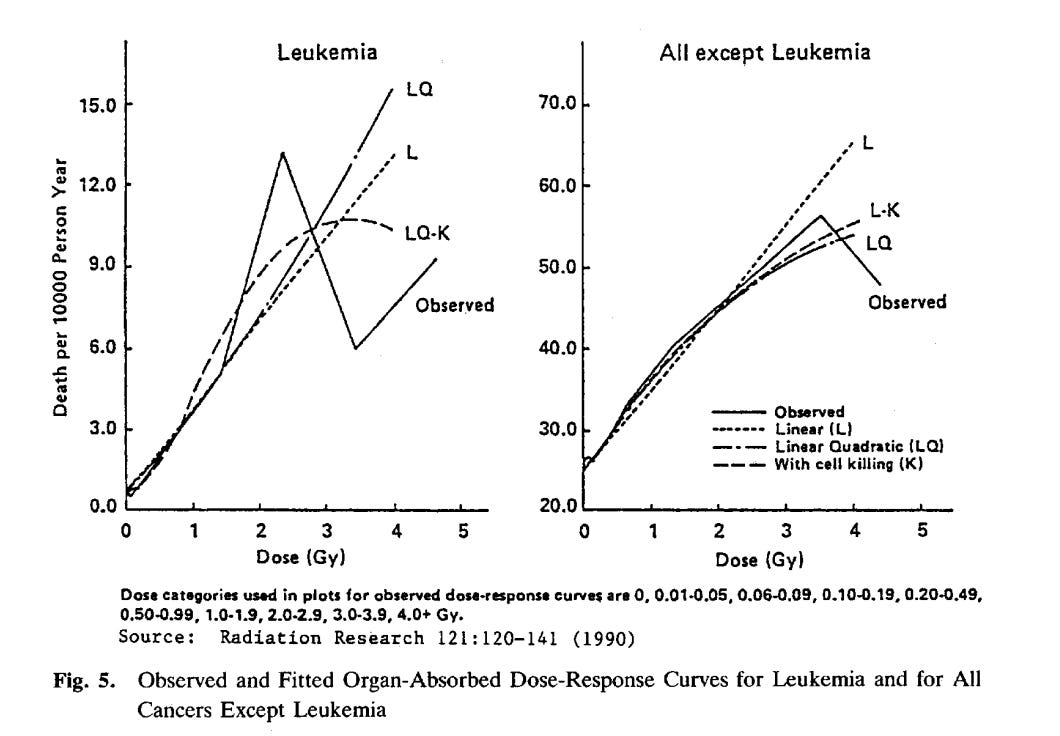
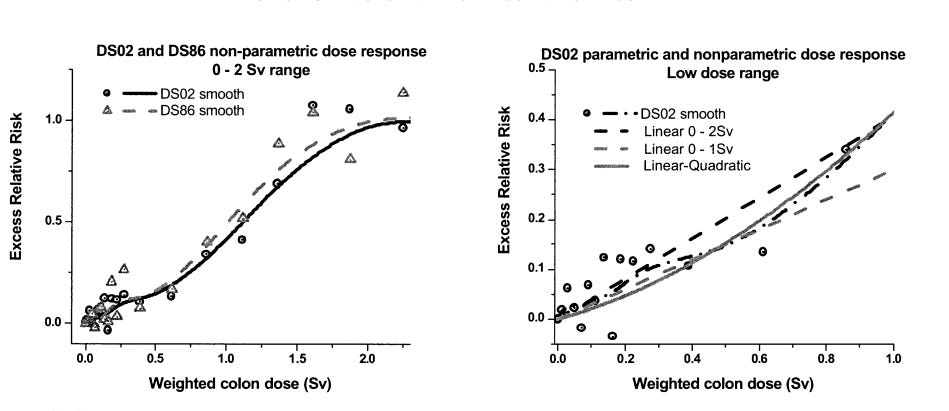
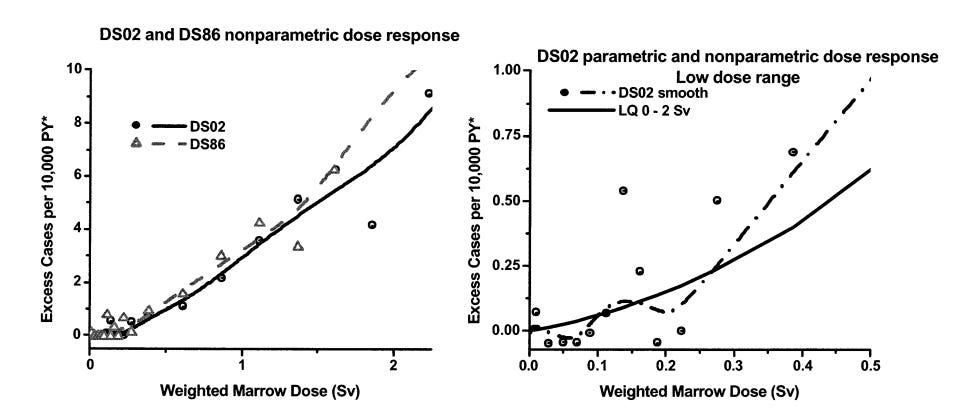
For leukemia, the acceptance that the dose response in the RERF data is non-linear goes back to at least the early 1990's. In fact, Shimizu et al (RERF employees) realized that both the RERF leukemia and solid cancer date were S-shaped, Figure 2.
Figure 2. Shimizu et al trial fits to the RERF data,\cite{shimizu-1991}[p 62]}
In their own words:
To determine the shape of the dose-response curve, a variety of models were fitted. For leukemia, when the entire dose range is considered, a linear-quadratic (LQ) model, with provision for downward curvature (the LQ-K model) at the high end, fits better than the linear model, but the LQ model does not fit better than the L model. However, when the dose range is restricted to doses under 2 Gy, the LQ model fits better than the L model.\cite{shimizu-1991}[p 62]
If the response is S-shaped, it's quite likely that a linear fit will score better than a quadratic or linear quadratic. The quadratic model turns the wrong way at the high end. The linear model is wrong at both ends; but, according to least squares, it's a better compromise.
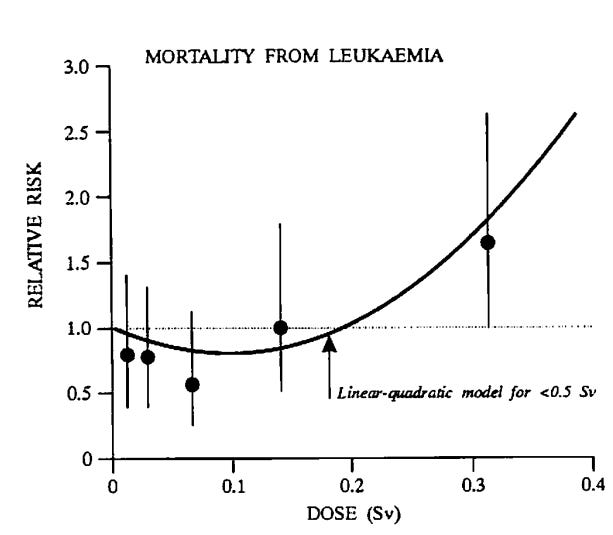
In a nuclear power plant release, the repair period dose range of interest is far below 2 Gy. It rarely more than 0.005 Gy in a day. Figure 3 is the linear-quadratic curve these authors fitted to their low end (less than 500 mGy) RERF leukemia data. This figure makes the point that the low end is clearly concave upward. However, the low end hook is relatively small and can easily get lost, if the dose range is large enough.
Figure 3. Shimizu et al fit to the low end RERF leukemia data,\cite{unscear-1994}[p 257]
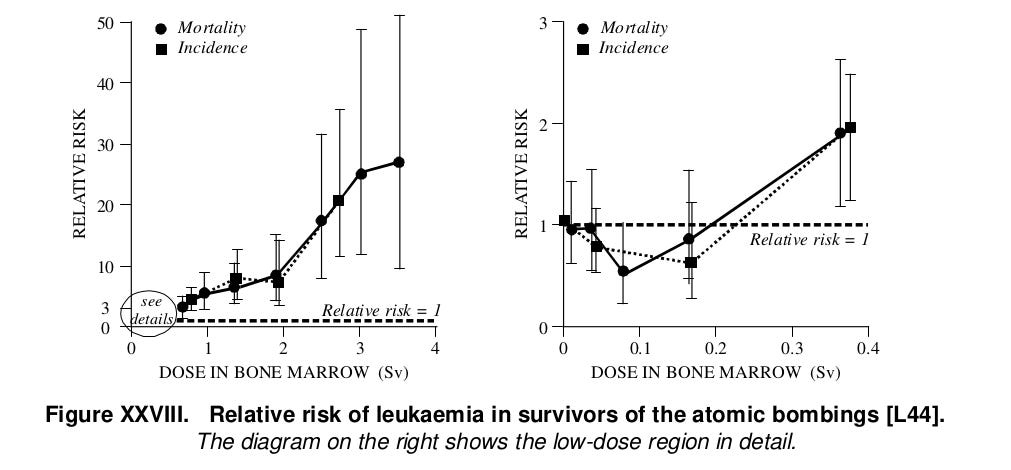
A few years later Little and Muirhead confirmed Shimizu et al's results, Figure 4. The error bars show that the null hypothesis of no effect cannot be rejected below about 200 mSv acute.
Figure 4. RERF leukemia incidence and mortality data,\cite{unscear-2000a}[p 155]}
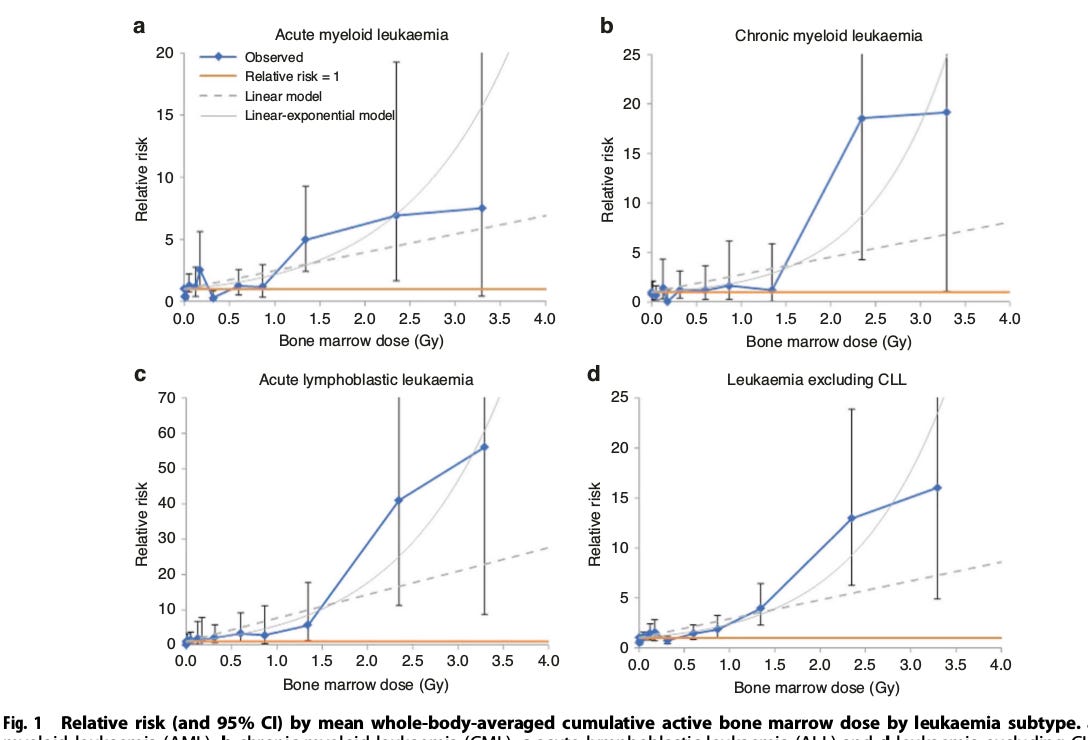
In 2023, Little and 19 others reported the results of a pooled analysis of ten cohorts of children and adolescents, including the young portion of the RERF population.\cite{little-2023} Figure 5 summarizes the results. The response is pretty clearly S-shaped, which seems to have escaped all 20 authors notice. Little et al only say
We observed significantly increasing risk with dose for AML, CML and ALL, with some indication of upward curvature in the dose response over the full dose range for all three endpoints,\cite{little-2023}[p 1157]
Figure 5. Pooled childhood leukemia incidence and mortality data,\cite{little-2023}[p 1158]
In summary, the RERF acute dose leukemia data is clearly non-linear. There are strong indications that the response is S-shaped.
Solid cancers
Preston-2004
In 2003, the RERF did a big revision of their dosimetry data (which is based on a series of guesses.) In 2004, Preston et al summarized the results.\cite{preston-2004} The new data is called DS02; the old was DS86.
Figure 6. RERF Solid Cancer Incidence from \cite{preston-2004}[p 385]
Preston et al find statistically significant curvature in both the leukemia and solid cancer ($P = 0.01$) mortality data.\cite{preston-2004} They accept that the leukemia response is non-linear, but toss their solid cancer results aside using an unusual argument.
With either DS02 or DS86, when testing for nonlinearity using a linear-quadratic dose–response model, we find evidence of statistically significant upward curvature (P 5 0.01 for DS02 and P 5 0.03 for DS86) in the solid cancer dose response over the range 0–2 Sv.\cite{preston-2004}[p 384]
After getting statistically significant curvature at $P = 0.01$ over the range 0 to 2000 mSv dose for solid cancers, Preston et al ran linear only fits over narrower ranges at the low dose end: 0 to 1000 mSv, then 0 to 500 mSv, and then 0 to 250 mSv. The slopes of the regression lines ``although quite imprecise" became larger as the top end cut off dropped over this range. For a quadratic model, which is RERF's definition of non-linearity, the slope gets larger as you move away from zero. Preston et al conclude, since these results are inconsistent with a quadratic response, we should assume LNT. Another false dichotomy. An increasing slope with decreasing dose is inconsistent with both LNT and a quadratic response. Preston et al either have to accept a decreasing dose-response function, or toss out the results of their narrowing exercise. They do neither.
Preston et al admit that the leukemia response is curved.
The leukemia data exhibit statistically significant upward curvature over the full dose range (P 5 0.002), and as in previous reports the primary model fit reported above uses a linear-quadratic dose response.\cite{preston-2004}[p 386]
Figure 7. RERF leukemia Incidence from \cite{preston-2004}[p 385]
Preston et al conclude with this strange statement:
A notable point in the analysis here is not due to dosimetry change but to additional follow-up, namely that there is for the first time seen a statistically significant upward curvature, on the restricted dose range 0–2 Sv, in the apparent solid cancer risk. Such nonlinearity is not seen in the current follow-up for solid cancer incidence, and it is doubtful whether what is now seen for mortality is in line with the type of upward curvature that might be expected on radiobiological grounds [ref. (25), Annex B] but has been lacking in these data. This is because the directly estimated risks in restricted dose ranges of 0–1 Sv, 0–0.5 Sv, and 0–0.25 Sv are much greater than the low-dose slope of the linear-quadratic fit on the range 0–2 Sv. This is very different from leukemia, where use of a linear-quadratic model has been well accepted.\cite{preston-2004}[p 388]
Emphasis mine. Apparently the difference between Figures 6 and 7 is that others accept that leukemia response is non-linear but solid cancer is not.
Ozasa-2012
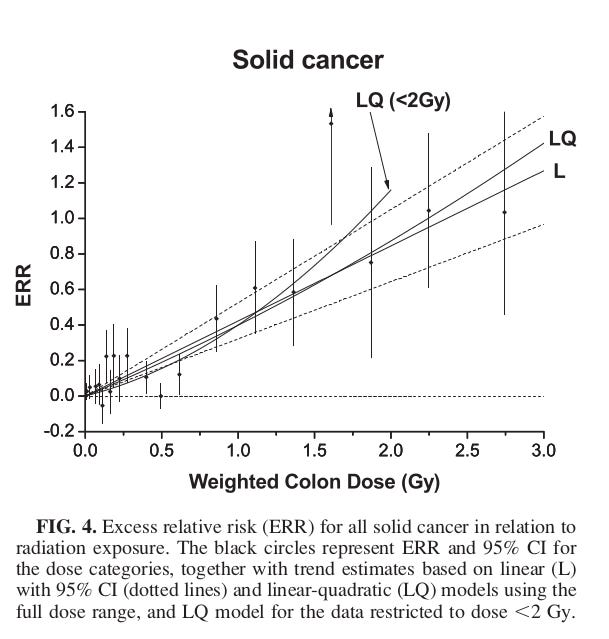
In 2012, Ozasa et al updated the RERF data to include the new deaths. Even after RERF massaging, Ozasa et al come to the conclusion that the solid cancer response is non-linear in the dose range 0 to 2000 mSv, Figure 8.
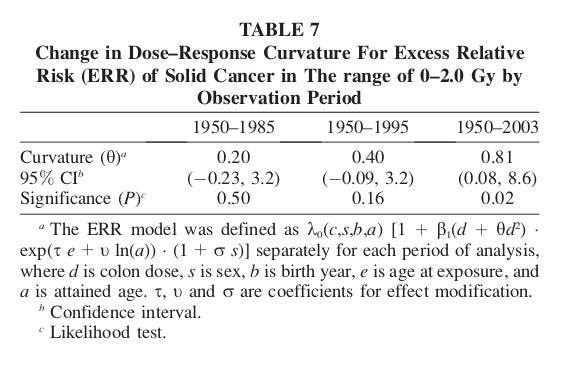
Although the linear model provided the best fit in the full dose range, statistically significant upward curvature was observed when the dose range was limited to 0-2 Gy [0 to 2000 mSv] (P=0.02).\cite[page 234]{ozasa-2012}
An acute dose of 2000 mSv is far above the range of interest for the public in a nuclear power plant release. In the RERF data, there is pretty clear evidence of some sort of saturation above 2000 mGy. The data has downward curvature at the high end. An SNTer would call that the upper end hook of the S. But if you only compare quadratic with linear, the quadratic turns the wrong way at the upper end; so linear wins this two way comparison.
Figure 8. RERF Solid Cancer Incidence from \cite{ozasa-2012}. This is a typical RERF graph. The very low end, where almost all the data is and where all the interest is, is mushed together into a tiny jumble. Figures 3 and 4 are rare exceptions.
Ozasa et al conclude by pointing out that the RERF solid cancer data has become more and more curved as time passes, Table 1. Part of this is changes in the dosimetry. Part may be due to an increase in statistical power as the number of cancer cases increases, making the shape of the curve clearer. Whatever the reason, it is bad news for LNTers.
Table 1. RERF Solid Cancer Curvature through time. Curvature to the RERF is the ratio of the quadratic coefficient to the linear.
Grant: 2017
The RERF solid cancer data just keeps getting more curved. The most recent update of the RERF data is Grant et al.\cite{grant-2017} This update was based on yet another revision of the dosimetry. These authors find solidly significant upward curvature in the male data, but only weak curvature in the female data. If you assume that LNT is the null hypothesis (which you have no right to do), you cannot reject LNT for women.
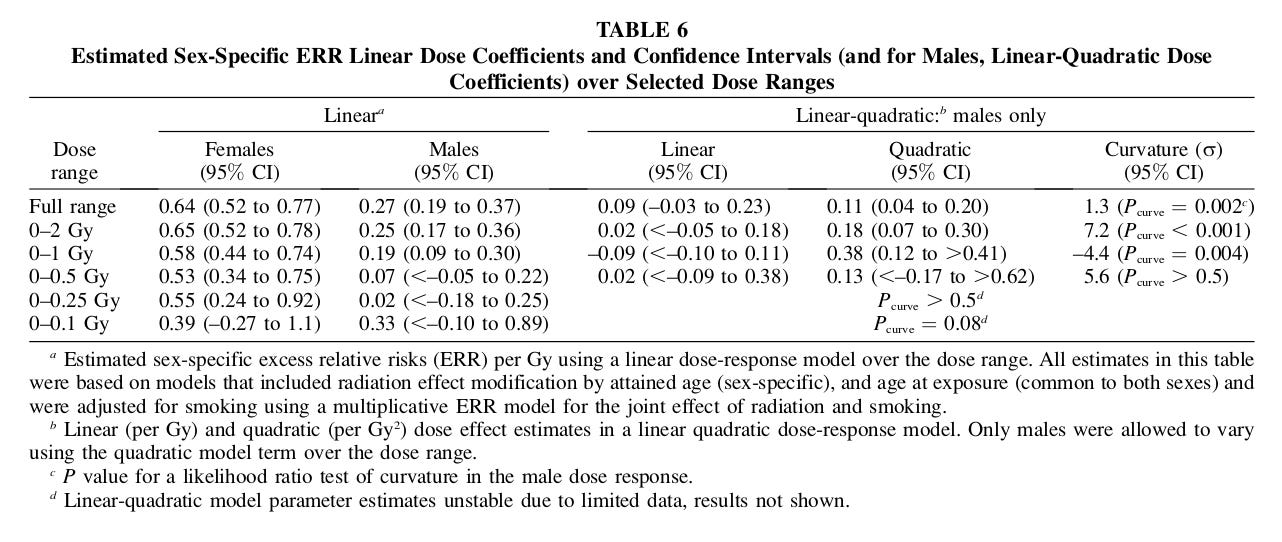
Check out Table 2. On the left is their best fit pure linear model, for a range of acute dose ranges. The increasing slope with decreasing dose range has disappeared. On the right is their best fit linear-quadratic model for men. Even if you confine yourself to a linear model, you cannot reject a slope of zero for doses less than 100 mGy for women and less than 500 mGy for men. 100 mGy is far, far above the repair period doses encountered by the public in a nuclear power plant release.
Table 2. RERF Solid cancer results per Grant et al.\cite{grant-2017}
But what's interesting about Table 2 is the right side. You can't reject a linear term of zero in a linear-quadratic model for any of the shown dose ranges. The cryptic comment about "unstable" is not explained in the paper. 80% of the RERF data is below 0.1 Gy. How can a least-squares calc go "unstable"?
Here is Grant et al's own summary of their results. Their unusual definition of curvature is the ratio of the quadratic coefficient to the linear coefficient. If that ratio is greater than 1/4, they accept that the data is curved.
The dose response, however, exhibited statistically significant (P ¼ 0.03) upward curvature in a linear-quadratic dose-response model that assumed common curvature for males and females. The common curvature (r) was estimated to be 0.22 per Gy (95% CI: 0.01 to 0.60). The linear dose coefficients for males and females were 0.21 (95% CI: 0.12 to 0.31) and 0.49 (95% CI: 0.33 to 0.67), respectively (data not shown). Allowing the curvature to differ for males and females led to a further statistically significant improvement in fit (P ¼ 0.02 compared to the common curvature model and P ¼ 0.007 compared to the linear model). For males, the linear dose coefficient was 0.087 (95% CI: –0.03 to 0.23) with a quadratic estimate of 0.11 (95% CI: 0.04 to 0.20) resulting in a curvature estimate of 1.3 (Pcurve ¼ 0.002). For females, the linear estimate was 0.57 (95% CI: 0.40 to 0.77) with a quadratic estimate of 0.049 (95\% CI –0.06 to 0.16) and a curvature estimate of 0.084 (Pcurve ¼ 0.39). Thus, while the dose response for females was consistent with linearity, for males it exhibited significant upward curvature.\cite{grant-2017}[p 523]
Emphasis mine. The sentence in bold says it all.
NCRP Commentary 27.
The upward curvature seen in males does not necessarily argue against LNT; it may suggest an LDEF > 1 (i.e., a lower slope at low doses than at high doses).[Oxymoronic gibberish from NCRP Commentary 27, p 48]
The high priests at the National Council on Radiation Protection (NCRP) guide our radiation protection policy. In 2018, the NCRP published a defense of LNT called Commentary 27.\cite{ncrp-2018} Preposterously, Commentary 27 claims the RERF data is one of 5 out of 29 epidemiological studies that ``strongly supported" LNT and gives Grant et al, 2017 as the reference.2
But the RERF has admitted for 30 years that the leukemia data is significantly non-linear. Leukemia is a far more radiosensitive than solid cancer with relative risks 4 to 10 times higher than solid cancer. Grant et al say that solid cancer response to acute doses is curved and for men strongly so. How is this ``strong support" for LNT?
The contortions in Commentary 27 show that the expert committee have not misread the data; they have misrepresented it.
On page 20, they admit that the leukemia data is non-linear:
The dose response for leukemia is LQ [linear-quadratic] in form whereas for solid cancers combined it is closer to linear, and the slope of the linear (low dose) segment of the leukemia dose response is steeper than the slope of the solid-cancer dose response.\cite{ncrp-2018}[p 20]
RERF leukemia then simply disappears from the Commentary. They move quickly on to solid cancer.
Though a pure quadratic dose-response curve provided a poor fit to the data, the most recent solid-cancer mortality and incidence data provide evidence of LQ upward curvature at lower doses, implying an LDEF > 1 and suggesting a shallower dose-response slope at low doses than at higher doses.\cite{ncrp-2018}[p 43]
The NCRP is playing games here. The most recent mortality data (Ozasa-2012) was based on older dosimetry. Grant-2017 is based on the improved dosimetry; but they reported only cancer incidence. Even if you misleadingly imply that Ozasa is the most recent mortality data, the pure quadratic fit to the Ozasa data below 2000 mGy was as good as the linear fit. With the improved dosimetry in Grant et al, linear-quadratic was significantly better for men than linear. And Grant rather quietly admit
The linear-quadratic model in men offered no statistical improvement over a purely quadratic model over the full dose range (P ¼ 0.11).\cite{grant-2017}[p 523]}
Emphasis mine. This is an extremely important admission. Pure quadratic and linear-quadratic are entirely different animals in the all important very low dose range. As the dose approaches zero, the linear quadratic slope goes to whatever the linear coefficient is. The quadratic term disappears and we are left with a form of LNT. The pure quadratic slope goes to zero at zero dose. This creates many orders of magnitude differences at extremely low doses. This lack of improvement was pretty obvious from the tiny linear coefficients in the right-hand side of Table 2. According to the Akaike Information Criterion, which balances goodness of fit and number of parameters, the quadratic model should be preferred over linear-quadratic.
Back to Commentary 27. The RERF leukemia data is admittedly highly non-linear; the most recent RERF solid cancer data is significantly (P = 0.03) non-linear; but in their summary of the RERF data, the NCRP blatantly claims
A pure quadratic model provided a significantly poorer fit to the dose-response data than a linear model for both solid-cancer incidence and mortality,
...
In summary, the study provides strong indirect support for the use of an LNT model, with consideration of a DDREF factor, for use in radiation protection.\cite{ncrp-2018}[p 49]
At this point, we have moved from misleading to untrue.3
Throughout Commentary 27, the NCRP fallaciously assumes LNT is the null hypothesis. It even goes so far as to admit
It is important to note that the use of an LNT extrapolation model is really a default approach because of a lack of definitive evidence to the contrary.\cite{ncrp-2018}[p 12]
It seems we must disprove LNT. Despite all the curvature, I suppose one can argue that the RERF data does not definitively disprove LNT on the grounds of dubious dosimetry. Since low dose rate radiation is such a weak carcinogen, low dose rate populations cannot definitively disprove LNT. The signal to noise ratio is too low. Fortunately, there is a definitive test. LNT's fundamental error is its denial of our ability to repair radiation damage.4
That ability is indisputable. Biology trumps epidemiology.5 But if you want to see that biology in action, compare populations such as the bomb survivors, who received large doses in a very short period, with populations that received as large or larger doses more or less evenly over years, such as the radium dial painters. Commentary 27 is 210 pages long. The dial painters are never mentioned.
RERF is Radiation Effects Research Foundation, jointly financed by the Japanese government and the US Department of Energy.
One of the other 5 strong supporters was Preston's 2008 study of cancer in bomb survivors who were in utero or infants at the time of exposure.\cite{preston-2008} Since this group is a subset of the RERF population, this is a form of double counting.
Commentary 27 is focused on low dose rate radiation. ``Indirect" in this context is a concession to the fact that the RERF data is extremely high dose rate. The ``indirect" disappears in the key summary table
For the doryphores, LNT could be combined with a repair process which somehow repairs a fixed proportion of the damage nearly instantaneously. We know that's not how repair works.
Despite the fact that any epidemiologically based model must at a minimum be biologically plausible, Commentary 27 carefully stays away from biology. But in support of LNT, there is an indirect reference to the single hit theory of cancer.\cite{ncrp-2018}[p 21] But even if the single hit theory is true, it is a possible argument against a non-zero threshold. LNT is only one of an infinity of non-threshold models.


You should mention exposure to X-rays, and in particular mammography, the results of which are quite clear.
https://www.biorxiv.org/content/10.1101/238527v1.full
Mark Nelson cryptically mentioned to me that he thinks LNT will win, I wonder if it was based on this Commentary 27
My most probable hope for fusion is that routine relatively high tritium releases are unavoidable for normal operation, and suddenly there will be a strong new political interest to desanctify LNT