

This piece assumes you have recently read The Taipei Apartment Dweller Exposure

Figure 1. uGy/h contours for a low contaminated apartment. The frames are NaI Survey meters (upper left), TLD's (upper right), ESG4 model simulation (lower left), and room "averages" for the three methods (lower right). C is a column,and CB is a floor beam.\cite{hsu-2002}[Fig 3]}
Your preacher has belatedly done a bit more looking into the Taipei apartment exposure. It turns out the Taiwanese put quite a bit of effort into measuring the dose rates in the apartments. Unfortunately, most of the data is buried in file cabinets somewhere in Taiwan and the rest is heavily paywalled. I've only seen a small portion of the work.
They used three basic methods:
S. Survey meters using NaI scintillators. Apparently, 5 measurements were taken in each room: the center of the room, and the mid-point between the center in each wall.
T. The survey meters were calibrated in some 20 apartments by hanging 1mx1m network of thermoluminescent capsules(TLD) 1 meter above the floor and reading the devices after 2 weeks of irradiation. See Figure 2.
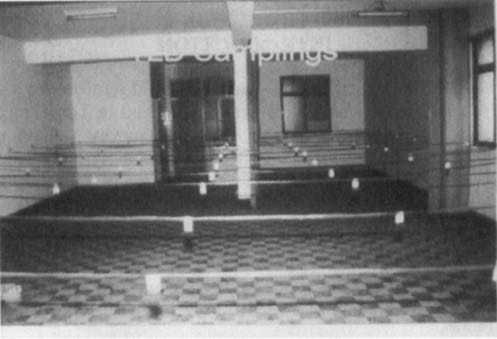
Figure 2. Grid of TLD's hanging 1 meter above the floor.\cite{tung-1998}
E. A Monte Carlo photon transport code, ESG4, was used to simulate the radiation field.
The TLD's and the computer simulation were in rough agreement, but the survey meters appears to have done a poor job of capturing the dose rates, Figure 1. Despite this, almost all the data is based on the NaI meters with some sort of correction. Figure 1 tells me it is quite unlikely the correction is very accurate.
The contaminated rebar was only used in the columns and floor beams. We have a grid of line sources. The columns show up fairly clearly in Figure 1. Figure 3 shows 1995 dose rate contours for a highly contaminated apartment. The range is 4 to 190 uGy/h, a factor of close to 50.

Figure 3. uGy/h contours for a highly contaminated apartment.\cite{tung-1998}[Fig 6] These are 1995 dose rates. The 1983 dose rates were 5 times higher.` The thick lines are floor beams.
It turns out that there were two major stages in the studies:
1. Early on the emphasis was estimating the worst case profiles. In this stage, the maximum dose rate in each room was used as the representative dose rate. The Chen 2004 paper was based on this philosophy.
2. In the second stage, the focus was estimating the "average" dose rate for each subgroup: elderly, working men, house wives, etc. Apparently a questionnaire was sent out to the residents asking them how much time they spent in each location in the apartment, and based on the answers they came us with their "average".
The results of the second stage were "two to six times" lower than the first. This explains a sizable portion of the difference between Chen's dose rate profiles and Hwang's, but not all.
But the important takeaway is that some of these people incurred some very impressive dose rate profiles. Hwang's numbers are almost certainly closer to group averages than Chen's. But given the non-linear dose rate response what we are interested in is the bad cases and for those worst cases we focus on the hot spots. Look at Figure 3. Suppose a child's bed had been put in the lower left corner near the 150 uGy/hr (1995) area. That kid would have gotten over 10 mGy/d every night she went to bed in 1983.
These dose rate profiles are worse than those that would be experienced even in a very large release with no evacuation. In a power plant release, the problem is outdoors. Here the problem was indoors. People can easily spend just about all their time inside for a while. The opposite is not so easy. And if a child wanders near a hot spot outside, he's unlike to stay there for more than a few minutes. Finally, the release profile will fall off much faster in the critical early period than these profiles did.
The fact that this group of heavily irradiated people suffered no detectable harm should tell us all we need to know about the horrors of a nuclear power plant release.
It would be interesting to compare this harmless exposure to the deadly Kramatorsk exposure. What I'm guessing is that there is a "saturation" of our DNA repair mechanisms with long-term exposures somewhere between 10 and 30 mSv per day. Each daily exposure is much less than the "threshold" of 100 mSv for a single exposure, but like an athlete pushing the limit day after day, our bodies need a few days to recover from each maximum stress. I'm looking for a model which will follow SNT for short exposures, but also explain hormesis and saturation.