
Radiation and Thyroid Cancer

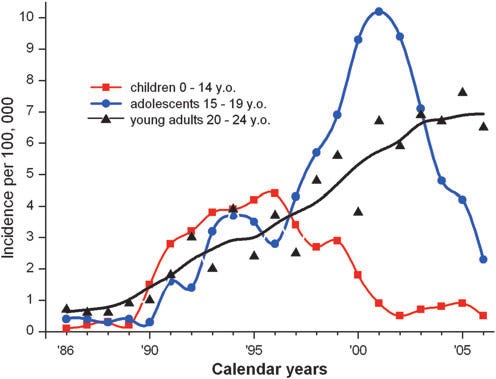
Figure 1. Childhood thyroid incidence in Belarus, 1986-2006.
In the three major releases of radioactive material to date from nuclear power plants, the only statistically significant radiation harm to the public that has ever been detected is a rather dramatic increase in thyroid cancer found in the young who were living near Chernobyl, Figure 1. The big problem in interpreting this jump is separating the apparent increase simply due to far more intensive screening from the real increase due to radiation.
At Fukushima, about 300,000 children received intensive thyroid screening. 191 thyroid cancer cases were operated on.\cite{yamashita-2018}[Table 2] With no special screening, the childhood thyroid cancer incidence rate is around 1 per million. The incidence was 0.00064 or 640 in a million. Intense screening resulted in a 600-fold increase in diagnosed cases.
There is no evidence that radiation has anything to do with this increase. Thanks to stringent control of contaminated food at Fukushima, almost all these kids received zero to near zero thyroid doses. There were no locational differences between kids closer to the plant and those farther away. The age distribution was inconsistent with a radiation induced spike. When a control program was instituted in Aomori, Yamanashi, and Nagasaki prefectures, nowhere near Fukushima, the detection rates were similar.\cite{hayashida-2013} Toki et al did a detailed study of the Fukushima child thyroid data.\cite{toki-2020} They found no statistically significant relationship between thyroid incidence and I-131 contamination.
However in a Belarus study, 16,213 kids were screened, and 87 had thyroid cancer.\cite{zablotska-2011} Assuming their screening was as intense as the Japanese, we would have expected 0.00064* 16213 = 10.5. In a Ukrainian, 13,127 kids were screened, and 45 had thyroid cancer.\cite{tronko-2006} We would have expected 0.00064* 13127 = 8.5. And there was a strong relationship between the size of the dose rate profiles and cancer incidence. I think something like 90% of these cancers was radiation related.
Almost all of these thyroid DRP’s has been traced to the consumption of milk contaminated with iodine-131. 20 to 30% of any iodine that is ingested ends up in the thyroid gland. An adult thyroid gland has a mass of only 15 grams, one five thousandths of a 70 kg body, and a child’s thyroid is smaller still. The thyroid dose is multiplied by a factor of 1000. At Chernobyl total dose to the thyroid ranged as high as 48,000 mGy.
More importantly, I-131 has a half-life of 8.04 days, and weathering cuts the half-life of iodine in the milk to about 5 days.1 These high total doses were incurred over a relatively short time, a few weeks. The dose rates could be as high as 2000 mGy/d.
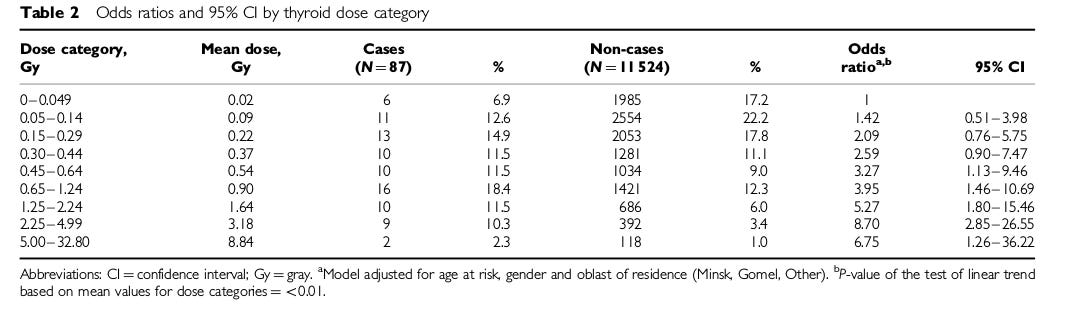
Table 1. Zablotska breakdown of Belarussian thyroid cancer data
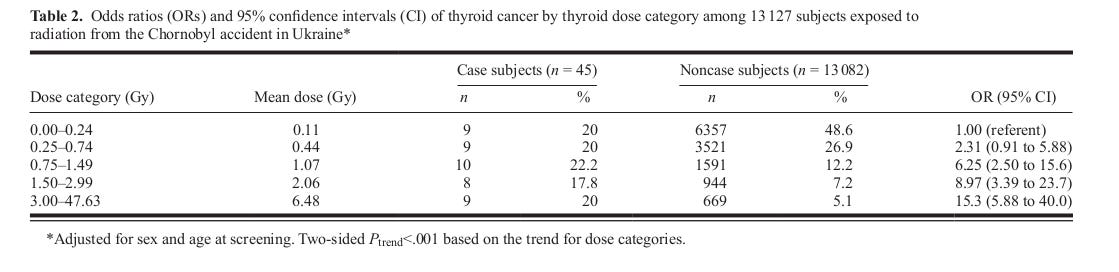
Table 2. Tronko breakdown of Ukrainian thyroid cancer data,
To estimate the dose rate profiles, the GKG uses a model which takes as input:
1) The peak I-131 concentration in the milk.
2) The ramp time in days it takes to get to that peak.
3) The time in days it stays at that peak. During this period, the increase in concentration is assumed to be matched by the decay. After this period, the milk contamination decays at the effective half-life of I-131.
4) Thyroid mass and uptake.
5) The amount of milk consumed per day,
The first three parameters allow us to compute an idealized milk contamination profile. These are shown as the dashed lines in Figure 2. The last two parameters allow us to convert that contamination profile into a thyroid dose rate profile, the solid lines in Figure 2.
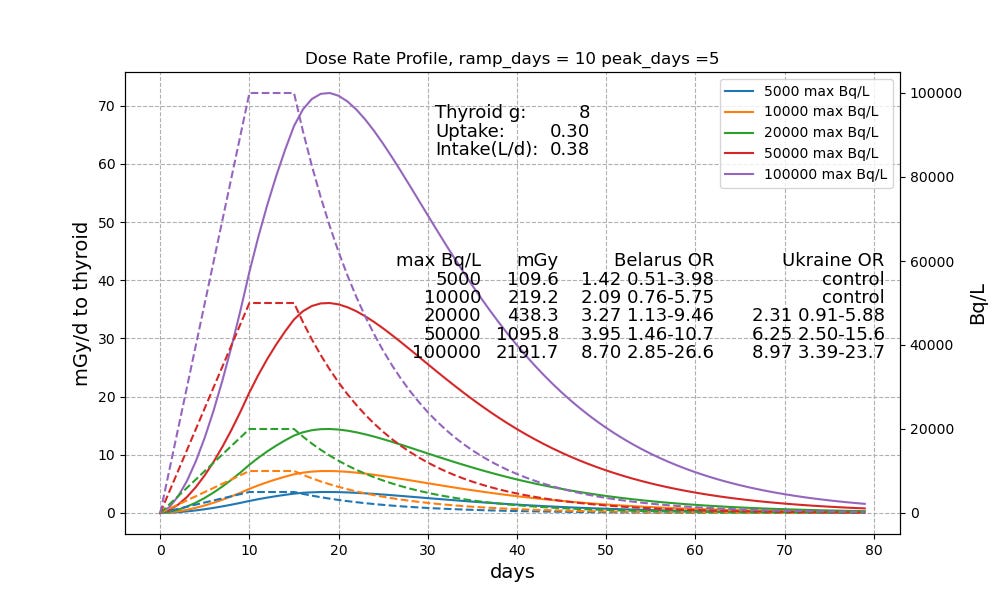
Figure 2. Milk Contamination (read right) and Thyroid Dose Rate Profiles (read left)}
Zablotska et al screened 11,600 Belarussian kids from the area around Chernobyl and found a mean thyroid dose of 560 mGy.\cite{zablotska-2011} Tronko did the same for 13,127 Ukrainian kids and came up with a mean dose of 730 mGy.\cite{tronko-2006} Close to 3000 children were above 1500 mGy. The highest measured cumulative dose was 47000 mGy. Figure 2 shows that, under our assumptions, it would take something like 30,000 to 40,000 Bq/L milk to get to the mean numbers. For the high end kids, the milk contamination must have been well above 100,000 Bq/L.
At Windscale, the highest milk contamination was 50,000 Bq/L on a farm 15 km from the reactor.\cite{henriksen-2013}[page 126] Chernobyl released 1000 times more I-131 than Windscale.\cite{tromedy}[p 166] I have been unable to find any milk contamination numbers for the areas close to Chernobyl. But in the Plavsk region of Russian, 500 kilometers from Chernobyl, 1000 to 5000 Bq/L were measured.\cite{iaea-2008} I would expect contaminations at least 20 times higher 30 km from the plant, on the edge of the Exclusion Zone.
The 50,000 Bq/L profile peaks out at just under 40 mGy/day. The kids who were drinking 100,000 Bq/L milk, got over 70 mGy per day. The Odds Ratio for the Zablotska and Tronko studies are shown on the graph. Because the incidence is low, the statistical power is quite poor. But we start seeing clearly significant increase in cancer at around 20,000 Bq/L. This corresponds to thyroid dose rates in the 10 to 15 mGy/d.
The cumulative doses in these dose profiles, shown in the column labeled mGy, are still far below the worst case thyroid doses observed at Chernobyl. The average dose in the Belarus cohort was 560 mGy. Under the assumptions of Figure 2, this corresponds to a peak milk contamination of 29,500 Bq/L and a peak dose rate of 21 mGy/d.
A lot of kids around Chernobyl exceeded 20 mSv/d to the thyroid. As a result, we have seen as many as 4000 thyroid cancers, and may end up with as many as 160 premature deaths. The one thing we must do in a release is prevent kids from drinking highly contaminated milk.
An SNT Model of Thyroid Cancer
We have fitted a 5 parameter logistic to the Belarus thyroid cancer data. The results are shown in the lower right corner of Figure 3. Astonishingly, it turns out the best fit is to assume a repair period of a day and use a curve which for all practical purposes is an exponential with an upper asymptote of only 0.0010, meaning even if the kid got an infinite dose in a day, the increase in cancer incidence for that day would be 0.0010. The lower hook is there; but it is so small compared to the thyroid doses these kids got it plays almost no role. The authors of the Belarus paper also found that an exponential fitted their data far better than linear, Figure 4. In fact, a linear fit was statistically rejected\cite{zablotska-2011}[page 183] They then proceeded to ignore that inconvenient fact, by focusing only on the low end, where the data is very roughly linear, the opposite of the usual LNT ploy. If you narrow the dose range of interest enough, you can always find a portion of a curve that is sort of linear.

Figure 3. SNT versus LNT on thyroid cancer.
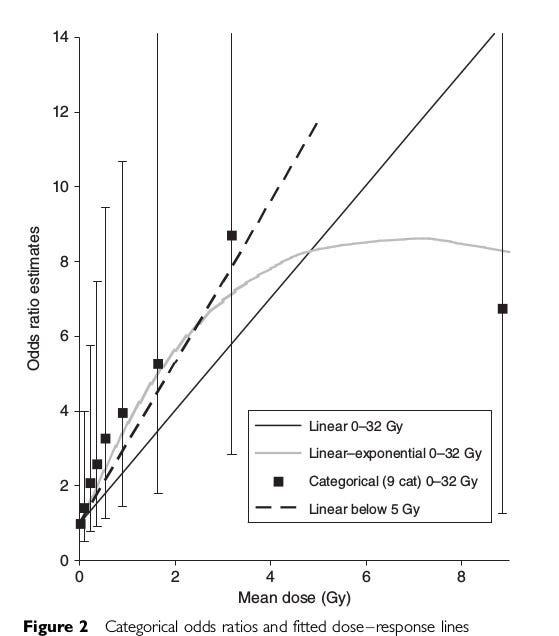
Figure 4. Exponential response to thyroid dose, Zablotska Figure 2. Note the massive error bars. Clinical childhood thyroid cancer is very rare, so the statistical power of the data is very poor.
Focusing on the cancer incidence columns in Figure 3, we see that LNT does an extremely poor job of replicating the thyroid cancer data. There is no LNT slope that can fix this. The 5 parameter logistic has no problem fitting the data. But the fit is very different from the fit to the RERF cancer data which we use to estimate cancer from external radiation.
The WHO says the Disability Adjusted Life Years associated with thyroid cancer is two years.\cite{who-2020} If we apply that to the SNT increase in cancer, we obtain the rightmost column in Figure 3. The expected Disability Adjusted Life Days for the Belarus cohort ranges from 3 to 15 days. Using the US dialysis standard, that a life day is worth $350, the compensation at Chernobyl would run from about \$1000 to $5000 per child. If we assume 50,000 children were involved, the total compensation would be very roughly \$150,000,000. It would have been far better to prevent the consumption of contaminated milk, as was done at Windscale and Fukushima.
Why the Different Response
We are left with the obvious question: why the big difference between the RERF LSS data and the thyroid data? Part of the explanation is the factor of 1000 magnification in dose rate puts us in the upper hook of the S. For the non-thyroid cancers, we are down in the bottom hook of the S and the response is better than quadratic in the repair period dose. For the upper end thyroid cancers we are well up into the upper hook of the S, and the response is far lower than linear in repair period dose. In this topsy-turvy region, fractionation is bad. If you have to get a dose, get it all at once.
It’s also true that clinical childhood thyroid cancer is extremely rare, so even if the repair period incidence flattens out at 1 in a thousand, that’s a thousand fold increase.
But that does not explain the big difference in the inflection point, the daily dose at which we move from the lower hook to the upper hook. For the RERF data that is 180 mSv in a day. For the best thyroid fit, it is only 0.6 mSv in a day. This seems to say that the thyroid is much more radiosensitive than the body as whole. The entire S is mushed to the left.
It’s also possible that it takes a lower dose rate to begin wiping out pre-existing thyroid nodules like an ablation. We don’t know. But one thing we cannot do is ignore the data, and pretend the response is linear. And as long as we prevent kids from drinking contaminated milk, we won’t need a separate compensation program for ingestion. Simply buy up the milk, turn it into cheese, and age it for about 3 months.
Biological half-life of iodine in the thyroid is around 120 days. The effective half-life is 7.5 days.
Yes. Fukushima vents are manual. I am about as big a fan of manual venting as I am of manual airbags in a car, with presidential override. Saturday morning cartoon level silly. Vent should be passive. Simple loop seal.
Still buffer zone is smart. Another reason to go offshore. No cows either
There's a confounding factor when attempting to compare Fukushima with Chernobyl. A significant fraction of the Ukraine and Belarus population was iodine-deficient, which both increases I-131 uptake and is itself an independent thyroid cancer risk factor, whereas the normal Japanese diet is rich in iodine.