
Updating BEIR VII
A Bayesian look at the Karunagappally cohort

Unfortunately, this piece requires a little background in probability. You will need a feeling for what a probability density is. I could not figure anyway around this.
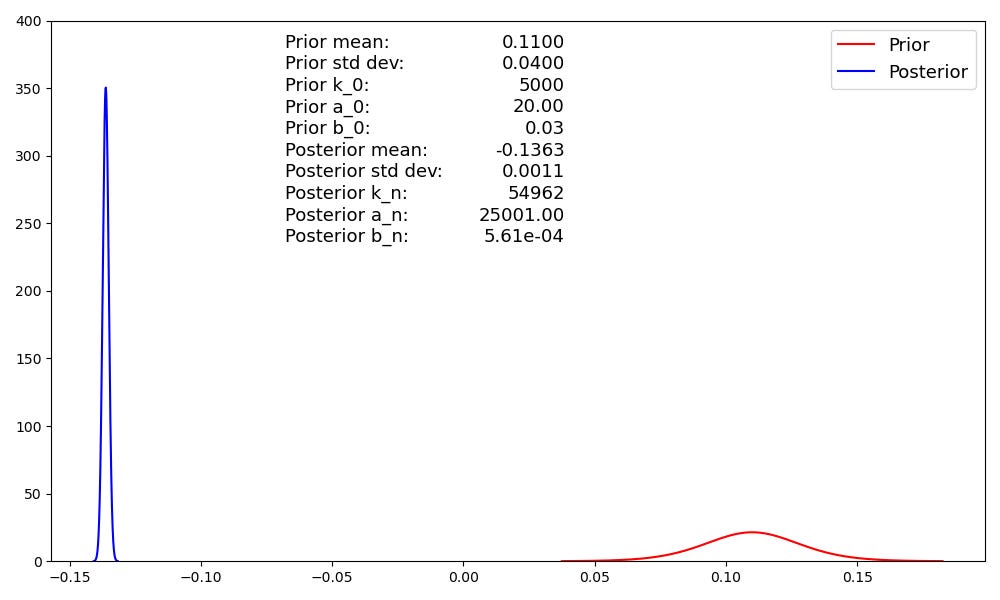
Figure 1. The BEIR Committee’s Prior and Posterior on the LNT slope. The blue spike says, after seeing the Karunagappally data, the Committee is nearly certain the LNT slope is somewhere between -0.11 0.126 and -0.13 0.146 per Sv.
Although it is 20 years old, BEIR VII is the most recent report by the National Academy of Sciences Committee on the Biological Effects of Ionizing Radiation.\cite{beir-2006} The report starts out with a version of The Dumbest Graph and maintains that static view of a dynamic process throughout. The report is over 400 pages long. TheUS shipyard workers, the Taipei apartment dwellers, Evans studies of the Radiothor drinkers, and most importantly, the the radium dial painters are never even mentioned. The Committee carefully avoids populations that have have received large doses spread over protracted periods, which is a test that any radiation harm model must pass. But in its Statement of Task, the Committee defines its job:
The primary objective of the study is to develop the best possible risk assessment for exposure to low dose, low linear energy transfer(LET) radiation in human subjects. In order to do this, the committee will (1) conduct a comprehensive review of all relevant epidemiologic data related to the risk of exposure to low dose, low-LET radiation;
...
In performing the above tasks, the committee should consider all relevant data, even if obtained from high radiation exposures or at high dose rates. \cite{beir-2006}[p vii][Emphasis mine.]
The Committee had to put that last part in because their preferred LNT model was almost entirely based on the atom bomb survivor data, which was large to enormous doses in a very brief period.1 But it makes their omission of the dial painters and the other large dose populations from a self-proclaimed “comprehensive review” scientific misconduct.
The unsurprising bottom line associated with this willingly blinkered approach is:
The Committee concludes that current scientific evidence is consistent with the hypothesis that there is a linear no-threshold dose-response relationship between exposure to ionizing radiation and the development of cancer in humans.\cite{beir-2006}[p 15]
I am not going to rehash how horribly LNT predicts cancer in situations where people have been exposed to very large doses spread over protracted periods. Nor am I going to waste any more time on why it goes so wrong. It’s too obvious. LNT denies our amazing ability to repair DNA damage, which is biological nonsense.
Rather I’m going to take a new tack. The authors of BEIR VII are Bayesians. How do I know that? On page 279 they gives us their best guess of the LNT slope (0.0970/Sv for men and 0.1410/Sv for women). But they admit these numbers might not be right. They also give us a Confidence Interval on these estimates. and they label that interval Subjective 95% CI. In the text they say ``The subjective confidence intervals reflect uncertainty due to sampling variability, transport, and DDREF.” The key word here is subjective. This tells me these confidence intervals were based on the Committee’s judgement, not the product of some statistical test. The Committee is prepared to quantify their subjective feelings about uncertainty, and call it a Confidence Interval. That’s as Bayesian as you can get.
Those 95% Confidence Intervals are quite wide. For men, it’s 0.0490 to 0.1920, a range larger than the mean. For women it’s 0.0740 to 0.2690, even wider. The Committee is honest about the fact that they are quite unsure about the LNT slope.
The BEIR Committee and I are on the same page philosophically. We are both Bayesians, although I’m a little more hesitant to use informative priors than the Committee. But the key part of being a Bayesian is willingness to update your probabilities as new information comes in.
BEIR VII was published in 2006. In 2009, Nair published the results of the 15 year long study of the Karunagappally cohort. Karunagappally is a district in southwest India. The villages right on the beach sit on sands that are very high in thorium. These people experience dose rates up to 0.2 mSv/d their entire lives. Villages farther inland have much lower dose rates. Dr. Nair and his group carefully tracked some 70,000 people for 15 years. Figure 2 summarizes the results.
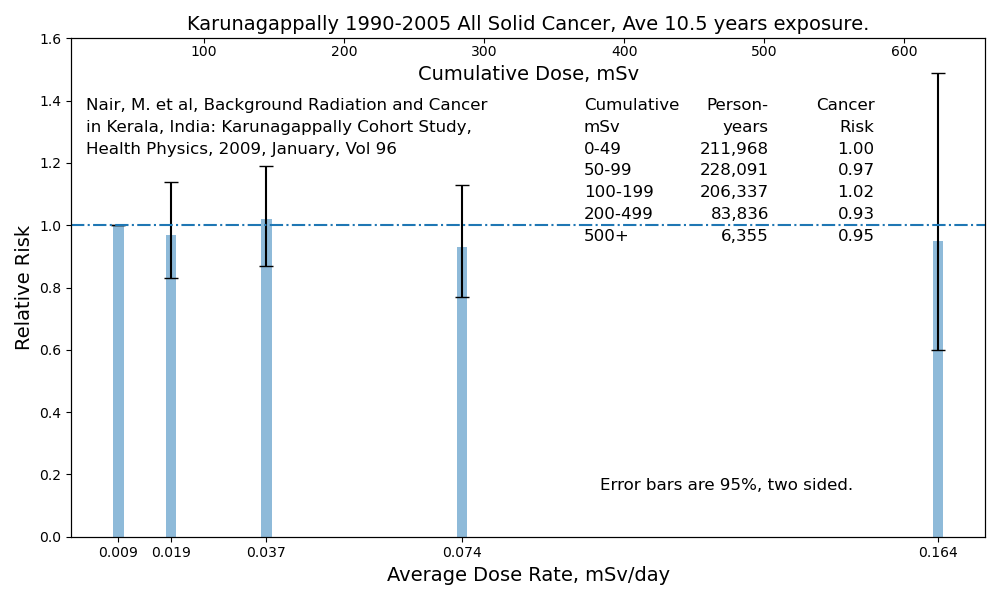
Figure 2. The results of the Karunagappally Study
As Bayesians, the BEIR Committee needs to update their probability density on the LNT slope to account for the new data. This is a completely mechanical process depending only on their old density, the data, and Bayes Rule. Being the helpful soul I am, I will do it for them.
I assume the Committee’s original density on the combined male/female LNT slope is a normal with a mean at the average of their male and female estimates and a standard deviation of 1/4 their 95% Confidence Interval. I also assume that the process generating Dr. Nair’s data is Normal with an unknown slope and an unknown variance. Notice here I’m assuming LNT is correct, which I’m sure the Committee agrees with. We just don’t know the slope of the straight line.
I concocted a probability density matching the Committee’s belief about the LNT slope prior to see the Karunagappally data, and updated that prior density according to the data and Bayes Rule to get the Committee’s posterior density after seeing the data. This updating process is purely mechanical and non-controversial. I won’t bore you with the details.2
Figure 1 show the results. The red line is the Committee’s density on the LNT slope, before seeing the Karunagappally data. It is centered on 0.11/Sv, that is a 1 Sv dose results in a cancer incidence of 0.11. The old standard deviation is about 0.04/Sv, which shows the Committee was pretty unsure of how accurate their best estimate was.
The blue line is the Committee’s new density on the LNT slope. It is very tightly grouped around -0.12. 70,000 people for an average of 10.5 years is a very large sample. So the data overwhelms the Committee’s wishywashy prior feelings. If you are a committed LNTer, you will be happy to know that the kind of dose rate profiles (DRP) incurred by the Karunagappallians decrease your chance of getting cancer.
I’m not an LNTer. I know its biological nonsense. Nor am I willing to accept Figure 1 at face value. I suspect that something else explains the lower cancer incidence of the higher dose rate profile people. Maybe living next to the sea is beneficial in itself. Maybe the people living next to the sea are wealthier. They have the option of fishing and thorium mining. But if you are an LNTers and a Bayesian as the BEIR VII Committee clearly is, and you attribute the cancer incidence to radiation, Figure 1 is conclusive. You must become a hormetian LNTer.
The Committee delayed the publication report so that they could make use of the 2002 update (DS02) of the bomb survivor dosimetry, on which they relied heavily. Since thenthe Radiation Effect Research Foundation has re-analyzed their data and concluded “significant upward dose response curvature was evident among both males and females.”\cite{brenner-2022} That’s why there probably never will be a BEIR VIII
For the doryphores, I assumed a normal process with both the mean and variance unknown, and put conjugate priors on these random variables. The prior parameters are shown on the figure. The resulting prior and posterior densities on the slope are Students; but the degrees of freedom are large enough that they are nearly Normals. It turns out you can tighten up the prior a whole lot and it does not change the result substantially.
One of my long running frustrations is the binning of data into arbitrary cohorts. That is confuscation at its worst, introducing all manor of bias and requiring further arbitrary artifacts such as error bars to be deployed. Sadly everyone and their grandmother seems to be doing it all the time.
If the data is good, then use a point cloud. My monitor contains over 2 million pixels. Plenty enough for even the most ambitious studies.
Since all of this is obvious, we can deduce that either the data is no good, or the scientists are no good. Maybe both!
Here's a nice tutorial on Bayesian statistics. I'm working through it. https://statswithr.github.io/book/the-basics-of-bayesian-statistics.html